Introduction
To a great extent, the proliferation of Homo Sapiens is a result of the pattern recognition and abstract thinking abilities of the human brain. Hence, the instinctive expectation that day trading based on the classification and generalization of "price pattern in the past - the evolution of price in the future" relationships, TA, ought to be a favorable venture as well. This instinctive expectation is a trap, as price evolution is anything but a predictable process.
Mathematically speaking, TA day traders look for correlations between past and future events. The existence of past-future correlations in liquid markets is ruled out by a simple argument - such a correlation would be a source of limitless wealth, which is impossible. This argument is in line with the practical observation that TA-based day trading has a negative result for about 90% of traders. Opposite to TA, here we show that short-term price evolution can be described as a random process without memory. It means that no matter how convincing a price pattern looks, or how much the market operator trusts his instincts predicting the short-term behavior of the price is impossible.
A simple example of a random process without memory can be produced using a fair coin. Let us run the following simulation:
- At the beginning of the game the bankroll is $10;
- the coin is tossed;
- if heads {the bankroll is increased by $1}; else {the bankroll is decreased by $1);
- go to 2.
Figure 1.
The experiment with the coin gives a rough idea about my study of SP500 daily price evolution presented in this chapter. In the study, the statistical properties of SP500 daily price evolution were measured using the available historical data. The presented measurement of the historical statistical properties of SP500's price evolution is in line with the efficient market hypothesis, therefore in its generalized form, the results of the measurement are applicable to any liquid/efficient market. The essential characteristics of the probability distribution of price evolution are discussed.
Probability Distribution of the daily return of the SP500 index.
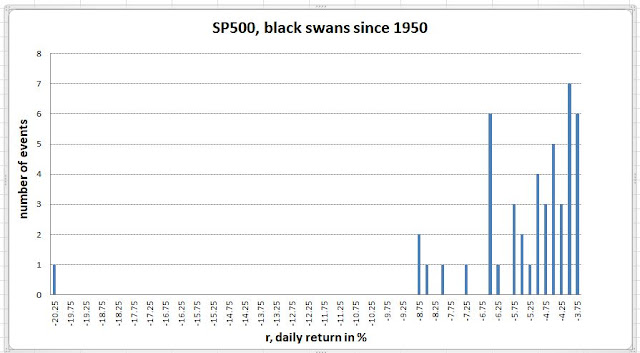
The data from SP500 was collected ranging from Jan. 3, 1950, to Dec. 31, 2018. That is 17,362 trading days. To obtain the probability distribution (the probability density of a daily return, p(r)), the histogram of the daily returns in % was calculated and normalized by dividing over 17,362. The results are shown in Figures 1 to 3. Figure 1 shows the major part of the distribution. The tails of the distribution - black & white swans that SP500 experienced since 1950 - are shown in Figures 2 and 3.
Figure 1.
The maximum of p(r) is around 0.2% which reflects SP500's tendency to be in a bull market.
Figure 2.
Figure 3.
Probability P(r).
The integral of p(r) from minus infinity to r, P(r), gives the probability of having a daily return less than r. P(r) is shown in Figure 4.
In particular, the chance of a negative daily return is given by P(0) which is 0.47. Accordingly, the chance of a positive daily return is 0.53.
The integral of r*p(r) from r1 to r2 divided by ( P(r2)-P(r1)), R(r1,r2), gives the daily return averaged over [r1,r2].
In particular, the average negative return is given by R(-inf,0) which is -0.65%. The positive return is given by R(0,inf) which is 0.64%.
PART I : Conclusion & Discussion
R(-inf,inf)=0.033% is the expected average return for day trading from the long side.
PART I : Conclusion & Discussion
After averaging, the daily return of SP500 can be viewed as a toss of an unfair coin - 0.47 tails, 0.53 heads - with an even payout, of 0.6%. This imaginary coin is slightly in favor of trading from the long side.
The calculated probabilities showed that in the short term, the SP500 market behavior is very much in agreement with a random process without memory - at every instant, the chance of price going up or down is practically the same, therefore price prediction is futile. This conclusion is in line with the efficient market hypothesis. It allows generalizing the presented historical distribution as the statistical law for the SP500 market. This law holds providing the market stays liquid enough to enable efficient price discovery. In other words, liquid markets are nearly always close to an equilibrium where all available information is priced in. Keep in mind that "nearly" is an important remark. Figures 2 and 3 provide evidence that on rare occasions the SP500 market can undergo a severe perturbation. Exploiting such events is the essence of the proposed method.
In the next part, a generic methodology of algorithmic day trading for a retail investor will be derived based on the calculated probability distribution.


No comments:
Post a Comment